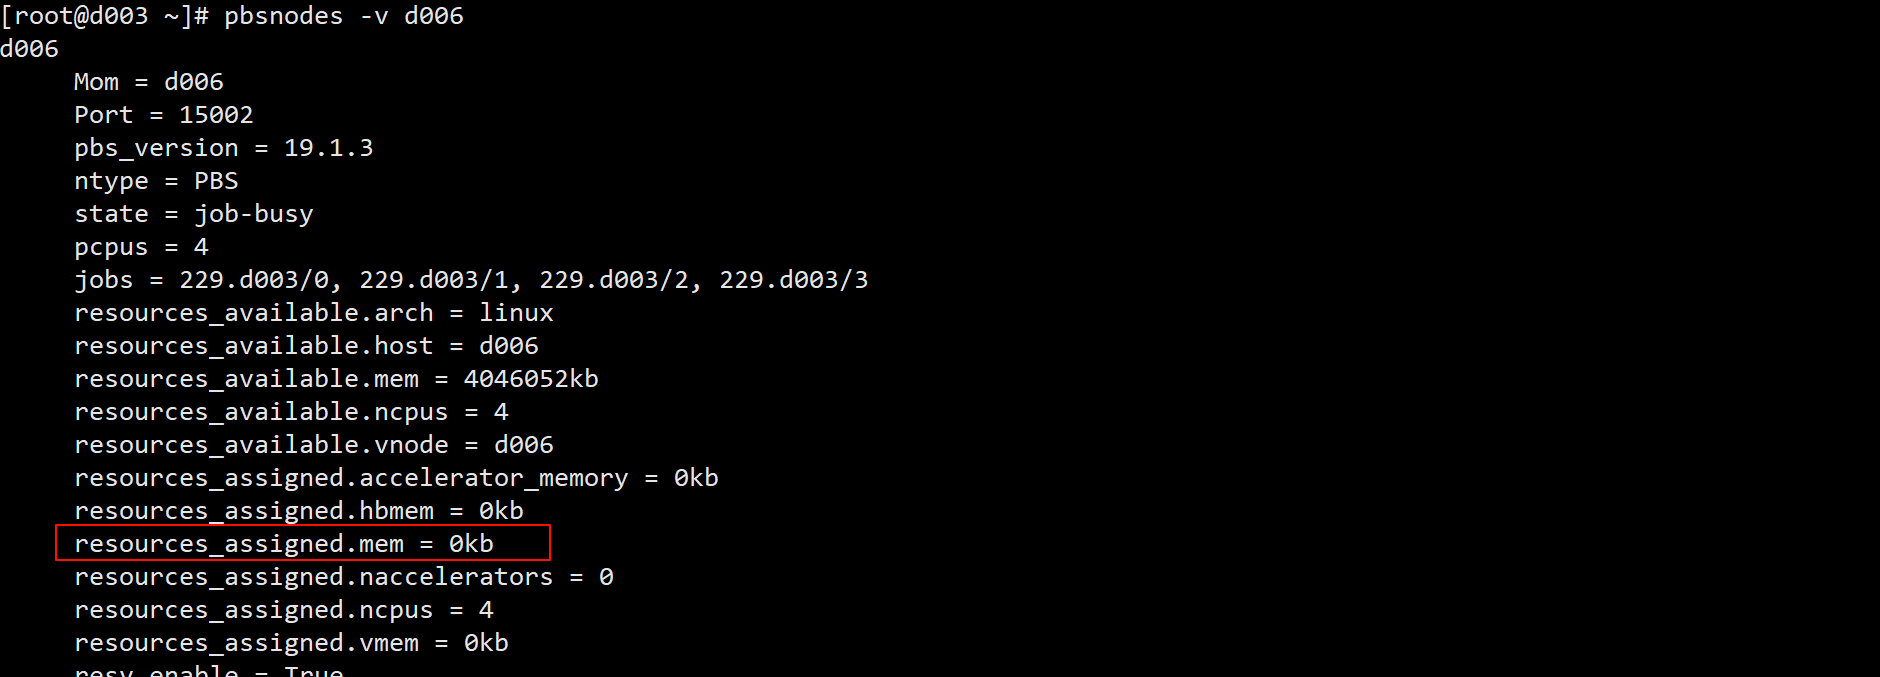
Node d003 is running two jobs, both of which occupy memory. But when I use the command(qstat -answ / pbsnodes d003) to view the properties, why is the memory allocation displayed incorrectly?


-
resources_available. depends on the qsub request
qsub -l select=1:ncpus=2:mem=2gb -l walltime=00:10:00 – /bin/sleep 100
- Try the above submission and check pbsnodes output .
- note this is not the report on the consumption of resources, it is allocation mapped by the scheduler. -
in the pbsnodes -aSjv output , f denotes free and t denotes total
For example-1, my test:
[pbsdata@rhel9 ~]$ qsub -l select=1:ncpus=4:mem=2gb  -- /bin/sleep 100
1001.rhel9
[pbsdata@rhel9 ~]$ pbsnodes -aSjv
                                                        mem       ncpus   nmics   ngpus
vnode           state           njobs   run   susp      f/t        f/t     f/t     f/t   jobs
--------------- --------------- ------ ----- ------ ------------ ------- ------- ------- -------
rhel9           job-busy             1     1      0      6gb/8gb     0/4     0/0     0/0 1001
[pbsdata@rhel9 ~]$ qstat -answ1

rhel9:
                                                                                                   Req'd  Req'd   Elap
Job ID                         Username        Queue           Jobname         SessID   NDS  TSK   Memory Time  S Time
------------------------------ --------------- --------------- --------------- -------- ---- ----- ------ ----- - -----
1001.rhel9                     pbsdata         workq           STDIN               2828    1     4    2gb   --  R 00:00:00 rhel9/0*4
   Job run at Wed May 29 at 11:54 on (rhel9:ncpus=4:mem=2097152kb)
[pbsdata@rhel9 ~]$ pbsnodes -av
rhel9
     Mom = rhel9
     ntype = PBS
     state = job-busy
     pcpus = 4
     jobs = 1001.rhel9/0, 1001.rhel9/1, 1001.rhel9/2, 1001.rhel9/3
     resources_available.arch = linux
     resources_available.host = rhel9
     resources_available.mem = 8106532kb
     resources_available.ncpus = 4
     resources_available.vnode = rhel9
     resources_assigned.accelerator_memory = 0kb
     resources_assigned.hbmem = 0kb
     resources_assigned.mem = 2097152kb
     resources_assigned.naccelerators = 0
     resources_assigned.ncpus = 4
     resources_assigned.vmem = 0kb
     resv_enable = True
     sharing = default_shared
     license = l
     last_state_change_time = Wed May 29 11:54:39 2024
     last_used_time = Wed May 29 11:54:36 2024
Example-2
[pbsdata@rhel9 ~]$ pbsnodes -av
rhel9
     Mom = rhel9
     ntype = PBS
     state = free
     pcpus = 4
     resources_available.arch = linux
     resources_available.host = rhel9
     resources_available.mem = 8106532kb
     resources_available.ncpus = 4
     resources_available.vnode = rhel9
     resources_assigned.accelerator_memory = 0kb
     resources_assigned.hbmem = 0kb
     resources_assigned.mem = 0kb
     resources_assigned.naccelerators = 0
     resources_assigned.ncpus = 0
     resources_assigned.vmem = 0kb
     resv_enable = True
     sharing = default_shared
     license = l
     last_state_change_time = Wed May 29 11:56:20 2024
     last_used_time = Wed May 29 11:56:20 2024

[pbsdata@rhel9 ~]$ qsub -- /bin/sleep 100
1002.rhel9
[pbsdata@rhel9 ~]$ pbsnodes -av
rhel9
     Mom = rhel9
     ntype = PBS
     state = free
     pcpus = 4
     jobs = 1002.rhel9/0
     resources_available.arch = linux
     resources_available.host = rhel9
     resources_available.mem = 8106532kb
     resources_available.ncpus = 4
     resources_available.vnode = rhel9
     resources_assigned.accelerator_memory = 0kb
     resources_assigned.hbmem = 0kb
     resources_assigned.mem = 0kb
     resources_assigned.naccelerators = 0
     resources_assigned.ncpus = 1
     resources_assigned.vmem = 0kb
     resv_enable = True
     sharing = default_shared
     license = l
     last_state_change_time = Wed May 29 11:56:20 2024
     last_used_time = Wed May 29 11:56:20 2024

[pbsdata@rhel9 ~]$ pbsnodes -aSjv
                                                        mem       ncpus   nmics   ngpus
vnode           state           njobs   run   susp      f/t        f/t     f/t     f/t   jobs
--------------- --------------- ------ ----- ------ ------------ ------- ------- ------- -------
rhel9           free                 1     1      0      8gb/8gb     3/4     0/0     0/0 1002
Hope this helps
1 Like
Unfortunately, the job remains the same and no memory usage data is shown. Is it because the job uses too little memory?

resources_assigned.mem is not the memory used by the job. It is the memory that the user has requested via qsub. eg: qsub -l select=1:ncpus=4:mem=2gb , please check the examples above
Also, please share the qsub command used and qstat -fx output.
The memory used by job is reported against resources_used.mem , you can find that in the qstat -fx output.
Reference: PBS Professional 2022.1 Administrator’s Guide, AG-94
resources_assigned:
The total of each type of resource allocated to jobs running and exiting in this complex, plus the total of each type of resource allocated to any started reservations.
Oh, I get it.
This is the qsub command.

This is all the qstat -fx output.

Is there a pbs command that allows me to directly see the memory usage of a node when running a job?

Please try with the new syntax,
Replace the below line
#PBS -l nodes=1:ppn=4
with
#PBS -l select=1:ncpus=4:mem=2gb
and submit the job with qsub.